By Kenneth Richard
Scientific Papers Predict Cooling In Coming Decades
A new scientific paper authored by seven scientists affiliated with the Russian Academy of Sciences was just published in the scientific journal Bulletin of the Russian Academy of Sciences: Physics.
The scientists dismiss both “greenhouse gases” and variations in the Sun’s irradiance as significant climate drivers, and instead embrace cloud cover variations — modulated by cosmic ray flux — as a dominant contributor to climate change.
A concise summary: As cosmic ray flux increases, more clouds are formed on a global scale. More global-scale cloud cover means more solar radiation is correspondingly blocked from reaching the Earth’s surface (oceans). With an increase in global cloud cover projected for the coming decades (using trend analysis), a global cooling is predicted.
Stozhkov et al., 2017
Cosmic Rays, Solar Activity, and Changes in the Earth’s Climate
Stozhkov, Y.I., Bazilevskaya, G.A., Makhmutov, V.S.,
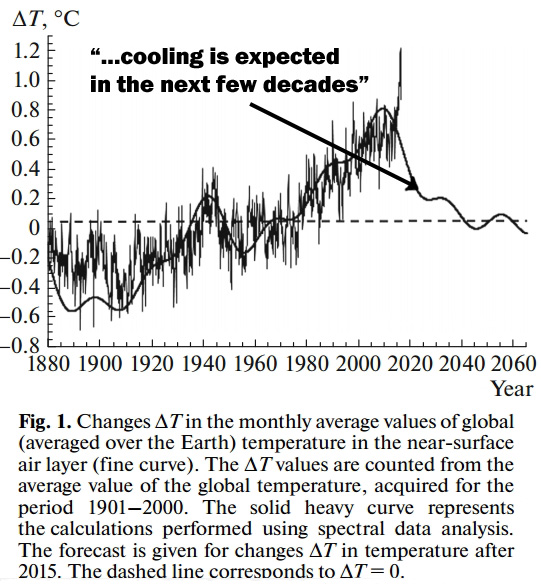
“One of the most important problems facing humanity is finding the physical mechanism responsible for global climate change, particularly global warming on the Earth. … Summation of these periodicities for the future (after 2015) allows us to forecast the next few decades. The solid heavy line in Fig. 1 shows that cooling (a drop in ΔT values) is expected in the next few decades.”
“Figure 2 shows the dependence between the annual average changes ΔT in the global temperature in the near-surface air layer and charged particle flux N in the interval of altitudes from 0.3 to 2.2 km. We can see there is a connection between values ΔТ [temperature] and N [charged particle flux]: with an increase in cosmic ray flux N, the values of changes of global temperature decrease. This link is expressed by the relation ΔT = –0.0838N + 4.307 (see the dashed line in Fig. 2), where the ΔT values are given in °C, and the N values (in particle/min units) are related to the charged particle flux measured at an altitude of 1.3 km. The correlation coefficient of the line with the experimental data is r = –0.62 ± 0.08.”
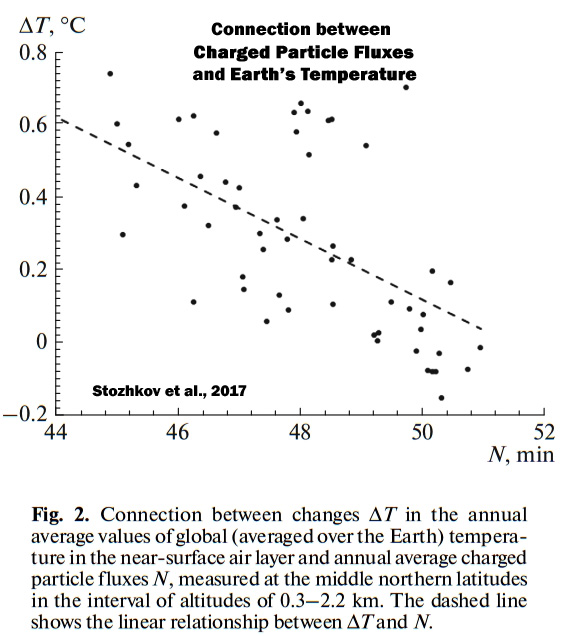
“Our results could be connected with the mechanism of charged particle fluxes influencing the Earth’s climate; it includes, first of all, the effect charged particles have on the accelerated formation of centers of water vapor condensation, and thus on the increase in global cloud cover. The total cloud cover is directly connected with the global temperature of the near surface air layer.”
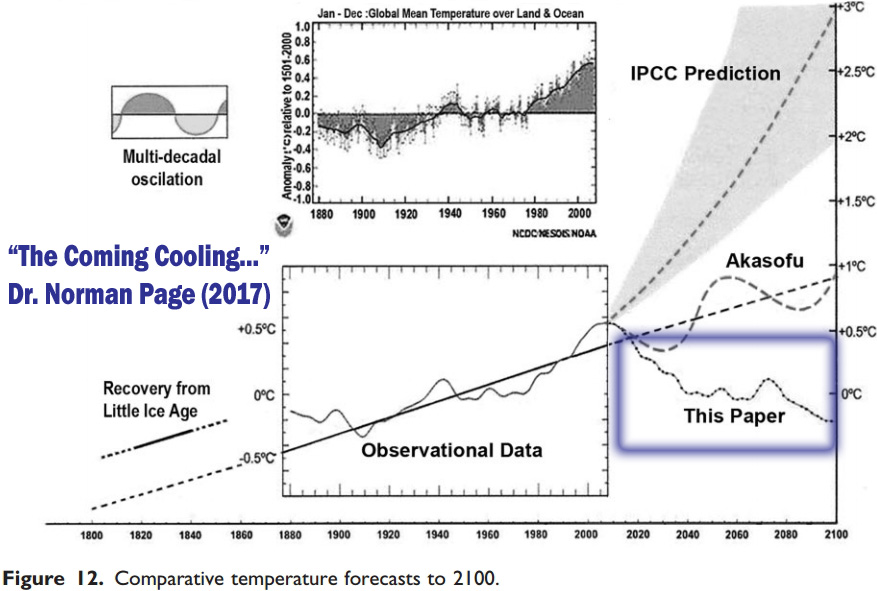
Another newly published scientific paper also projects cooling in the coming decades. Dr. Norman Page, geologist, attributes climate changes to natural (60-year and millennial-scale) cycles of solar activity (and cloud cover changes), and he notes that the rise in solar activity since the depths of the Little Ice Age has been the predominant climate driver. The millennial peak in solar activity occurred in about 1991, with the corresponding (lagged) temperature peak in 2004. Within the next few years the temperature is projected to drop significantly. Annotated graphs depicting the robust correlation between cloud cover changes and global temperature, as well as the forecasted global cooling, are included below.
Page, 2017
The coming cooling: Usefully accurate climate forecasting for policy makers
“This paper argues that the methods used by the establishment climate science community are not fit for purpose and that a new forecasting paradigm should be adopted. Earth’s climate is the result of resonances and beats between various quasi-cyclic processes of varying wavelengths. It is not possible to forecast the future, unless we have a good understanding of where the earth is in time in relation to the current phases of those different interacting natural quasi periodicities. Evidence is presented specifying the timing and amplitude of the natural 60 ± year and, more importantly, 1000 year periodicities (observed emergent behaviors) that are so obvious in the temperature record. Data related to the solar climate driver are discussed and the solar cycle 22 low in the neutron count (high solar activity) in 1991 is identified as a solar activity millennial peak and correlated with the millennial peak – inversion point – in the RSS temperature trend in about 2004. The cyclic trends are projected forward and predict a probable general temperature decline in the coming decades and centuries. Estimates of the timing and amplitude of the coming cooling are made. If the real climate outcomes follow a trend which approaches the near term forecasts of this working hypothesis, the divergence between the IPCC forecasts and those projected by this paper will be so large by 2021 as to make the current, supposedly actionable, level of confidence in the IPCC forecasts untenable.”
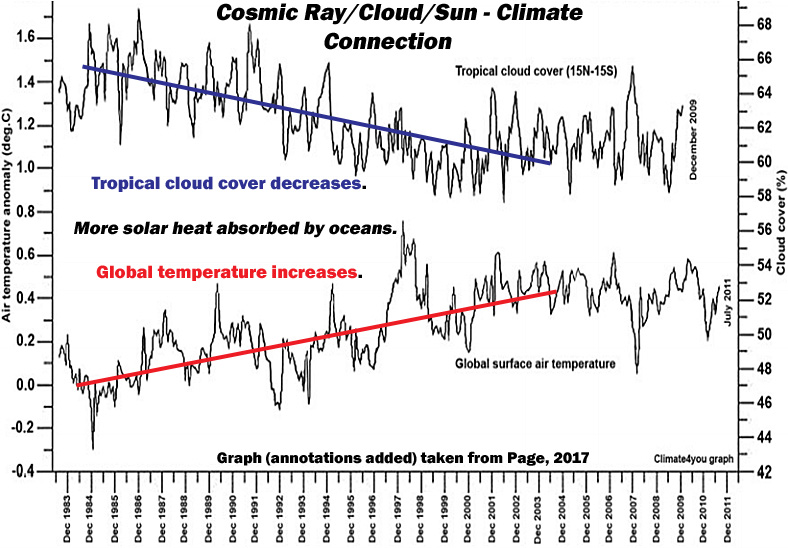
“The global millennial temperature rising trend seen in Figure 11 from 1984 to the peak and trend inversion point in the Hadcrut3 data at 2003/4 is the inverse correlative of the Tropical Cloud Cover fall from 1984 to the Millennial trend change at 2002. The lags in these trends from the solar activity peak at 1991 (Figure 10) are 12 and 11 years, respectively. These correlations suggest possible teleconnections between the GCR flux, clouds, and global temperatures.”
“Unless the range and causes of natural variation, as seen in the natural temperature quasi-periodicities, are known within reasonably narrow limits, it is simply not possible to even begin to estimate the effect of anthropogenic CO2 on climate. Given the lack of any empirical CO2-climate connection reviewed earlier and the inverse relationship between CO2 and temperature [during the Holocene, when CO2 rose as temperatures declined] seen in Figure 2, and for the years 2003.6–2015.2 in Figure 4, during which CO2 rose 20 ppm, the simplest and most rational working hypothesis is that the solar ‘activity’ increase is the chief driver of the global temperature increase since the LIA.”
– See more here
