By Chris A. Boulron Timothy M. Lenton & Niklas Boers
Mar 7, 2022
Abstract
The resilience of the Amazon rainforest to climate and land-use change is crucial for biodiversity, regional climate and the global carbon cycle. Deforestation and climate change, via increasing dry-season length and drought frequency, may already have pushed the Amazon close to a critical threshold of rainforest dieback. Here, we quantify changes of Amazon resilience by applying established indicators (for example, measuring lag-1 autocorrelation) to remotely sensed vegetation data with a focus on vegetation optical depth (1991–2016). We find that more than three-quarters of the Amazon rainforest has been losing resilience since the early 2000s, consistent with the approach to a critical transition. Resilience is being lost faster in regions with less rainfall and in parts of the rainforest that are closer to human activity. We provide direct empirical evidence that the Amazon rainforest is losing resilience, risking dieback with profound implications for biodiversity, carbon storage and climate change at a global scale.
Main
There is widespread concern about the resilience of the Amazon rainforest to land-use change and climate change. The Amazon is recognized as a potential tipping element in the Earth’s climate system1, is a crucible of biodiversity2 and usually acts as a large terrestrial carbon sink3,4. The net ecosystem productivity (carbon uptake flux) of the Amazon has, however, been declining over the last four decades and, during two major droughts in 2005 and 2010, the Amazon temporarily turned into a carbon source, due to increased tree mortality5,6,7. Several studies have suggested that deforestation8 and anthropogenic global warming9,10, especially in combination, could push the Amazon rainforest past critical thresholds11,12 where positive feedbacks propel abrupt and substantial further forest loss. Two types of positive feedback are particularly important. First, localized fire feedbacks amplify drought and associated forest loss by destroying trees13 and the fire regime itself may ‘tip’ from localized to ‘mega-fires’14. Second, deforestation and forest degradation, whether due to direct human intervention or droughts, reduce evapotranspiration and hence the moisture transported further westward, reducing rainfall and forest viability there15 and establishing a large-scale moisture recycling feedback. Net rainfall reduction may in turn reduce latent heating over the Amazon to the extent that it weakens the low-level circulation of the South American monsoon8. Model projections of future changes in the Amazon rainforest differ widely9,16,17,18. Early studies showed that the Amazon rainforest may exhibit strong dieback by the end of the twenty-first century9,19. Both pronounced drying in tropical South America and a weak CO2 fertilization effect18 contributed to this result, with dieback also more common under stronger greenhouse gas emission scenarios17. Other studies based on varying general circulation and vegetation model components show a wider range of results20,21. Nevertheless, the forest may be ‘committed’ to dieback despite appearing stable at the end of model runs16. This highlights the importance of measuring the changing dynamic stability of the forest alongside its mean state. Given the uncertainty in model projections, we directly analyse observational data for signs of resilience loss in the Amazon.
The mean state of a system is not usually informative of changes in resilience; either one can change whilst the other remains constant16,17. Thus, higher-order statistical characteristics that respond more sensitively to destabilization than the mean need to be considered to quantify resilience. To measure the changing resilience of the Amazon rainforest, we use a stability indicator used to predict the approach of a dynamical system towards a bifurcation-induced critical transition. The predictability arises from the phenomenon of critical slowing down22,23 (CSD): as the currently occupied equilibrium state of a system becomes less stable, it responds more sluggishly to short-term perturbations (for example, weather variability for the Amazon). This loss of resilience, which is itself typically defined24 as the return rate from perturbations, reflects a weakening of negative feedbacks that maintain stability. The behaviour can be detected by an increase in lag-1 autocorrelation (AR(1)) in time series capturing the system dynamics25,26. It may also manifest as an increase in variance over time but variance can also be easily influenced by changing variability of the perturbations driving the system27. Increasing AR(1) has been used to detect CSD before bifurcation-induced state transitions in a number of systems, including but not limited to climate25,28 and ecology29. In particular, CSD has recently been detected in reconstructions of western Greenland ice sheet height changes30 as well as of the variability of the Atlantic Meridional Overturning Circulation31. A caveat, highlighted by analysis of model projections before Amazon dieback27, is that a system should be forced slower than its intrinsic response time scale for CSD to occur (Methods). Hence, the absence of CSD may not rule out the possibility of a forthcoming critical transition. Conversely, increasing AR(1) can sometimes occur for other physical reasons. A space-for-time substitution has previously revealed that tropical forest resilience as measured by mean AR(1) (on a grid cell basis) is lower for less annual rainfall sums32 but changes of Amazon resilience over time have not been investigated so far.
We investigate controls on the resilience of the Amazon vegetation system and how its resilience has changed over the last three decades, in terms of a changing AR(1) coefficient as estimated from satellite-derived vegetation data. For comparison, we also investigate changes in variance over time, as a secondary indicator for CSD. The main dataset we use is from the Vegetation Optical Depth Climate Archive (VODCA)33 but we also analyse the NOAA Advanced Very-High-Resolution Radiometer’s (AVHRR) Normalized Difference Vegetation Index (NDVI)34 for comparison. Vegetation optical depth (VOD) has been previously used to estimate changes in vegetation biomass35, whereas NDVI is more commonly used to measure the greenness of vegetation (that is, photosynthetic activity36), which can saturate at dense grass cover. VOD, a microwave-derived product, does not saturate and remains sensitive to changes also at high biomass density35. We use the longer, Ku-band product from VODCA, which has a resolution of 0.25° × 0.25°, from which we create a monthly dataset by taking the mean values and for direct comparison we rescale the NDVI data to the same resolution. For a check of robustness, we also use the C-band product from VODCA, which spans a shorter time period. We focus on two stressors of the Amazon that may cause resilience changes—precipitation decline and human influence.
Results
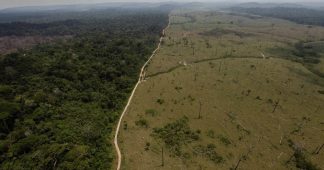
We use the Amazon basin as our study region and focus on those grid cells that have a ≥80% evergreen broadleaf (BL) fraction according to the MODIS Land Cover Type product in 200137 (Methods). Figure 1 shows that mean changes in BL fraction in this region correspond well to changes in VOD. Averaged across the Amazon study region we find overall decreasing VOD over 2001–2016, corresponding to the observed decrease in the number of grid cells that have BL ≥ 80% each year (Fig. 1a). Between 2001 and 2016, the BL fraction has changed most prominently in the south-eastern parts of the Amazon basin, along parts of the Amazon River and in some northern parts of the basin (Fig. 1b). Changes in VOD have a similar spatial pattern to changes in BL fraction, with decreases concentrated around the south-eastern edges of the forest (Fig. 1c). NDVI, in contrast, does not agree temporally or spatially with the changes in BL fraction (Supplementary Fig. 1), with NDVI increases observed in the south-eastern parts of the Amazon where deforestation rates are known to be highest. On the individual grid cell level, changes in BL are strongly correlated with changes in VOD (Pearson’s r = 0.556; Supplementary Fig. 2a) compared to changes in NDVI (r = −0.133; Supplementary Fig. 2b). This echoes previous in-situ comparisons between VOD and NDVI38. Hence, we focus our analysis on VOD in the following, with results for NDVI in the Supplementary Figures.
Continue reading at www.nature.com
We remind our readers that publication of articles on our site does not mean that we agree with what is written. Our policy is to publish anything which we consider of interest, so as to assist our readers in forming their opinions. Sometimes we even publish articles with which we totally disagree, since we believe it is important for our readers to be informed on as wide a spectrum of views as possible.
